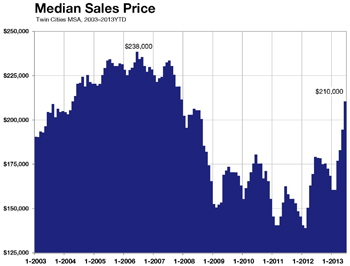
Housing isn’t just housing. That may have a strange ring to it. But housing includes building, inspecting, remodeling, lending, refinancing, furnishing and a host of other functions tied to the physical space of home. Each of these functions is tied to job growth and interest rates, and each has seen some spectacular highs and lows over the past eight years. There has been a recent sense of stability brewing in all of housing. Here’s to making the most of it.
In the Twin Cities region, for the week ending July 13:
- New Listings increased 25.1% to 1,921
- Pending Sales increased 26.5% to 1,352
- Inventory decreased 15.6% to 15,390
For the month of June:
- Median Sales Price increased 17.5% to $210,000
- Days on Market decreased 34.5% to 74
- Percent of Original List Price Received increased 2.5% to 97.5%
- Months Supply of Inventory decreased 25.0% to 3.6
Click here for the full Weekly Market Activity Report.From The Skinny.

In light of a 14.2 percent increase in pending sales, Twin Cities home buyers seem unphased by recent mortgage rate increases. Even with rates around 4.5 percent, the housing stock remains highly affordable by historical comparison. In 25 of the past 26 months, there have been year-over-year gains in pending sales; and the metric is currently at its highest level since June 2006. House hunters are watching seller activity for clues of additional inventory.New listings rose 20.0 percent, the second-largest gain since March 2010. Buyers have 15,193 properties from which to choose – 17.2 percent fewer than in June 2012 but 17.4 percent more than in January 2013.
The median sales price for the metro area rose 17.5 percent to $210,000. That’s the highest median sales price since December 2007. A shift in sales types is driving this price recovery. As recently as February 2011, foreclosures and short sales comprised 61.5 percent of all sales activity.
In June 2013, these two distressed segments together comprised just 21.7 percent of all sales. On the seller side, the percentage of all new listings that were distressed in June fell to 16.8 percent, its lowest level since September 2007.
Seller activity was up 20.0 percent overall, but traditional new listings surged 44.4 percent. Foreclosure new listings decreased 24.6 percent and short sale new listings fell 51.7 percent. With 16 straight months of year-over-year price gains, multiple-offer situations and just 3.5 months’ supply of inventory, the same market that recently favored buyers is now tilting toward sellers.
Looking at price movement by segment, the traditional median sales price rose 8.7 percent to $232,000; the foreclosure median sales price was up 16.9 percent to $145,000; the short sale median sales price increased 14.2 percent, also to $145,000.
On average, traditional homes sold in 68 days for 97.7 percent of original list price, foreclosures sold in 71 days for 98.2 percent of original list price and short sales lagged at 156 days and 93.0 percent of original list price.

A fellow named Newton once said that a body in motion tends to stay in motion. Presently, the housing market is going to be in a state of anti-motion, otherwise known as inertia. Each year, the activity around Independence Day collides with market trends because the summer holiday season ends up being more about family fun than housing fuss. As the market shifts from under us, things like historically low interest rates and rising rents cause pause for those with a clear idea of what they want despite the lack of funding to achieve it.
In the Twin Cities region, for the week ending June 29:
- New Listings increased 22.8% to 1,738
- Pending Sales increased 22.4% to 1,405
- Inventory decreased 16.8% to 15,405
For the month of June:
- Median Sales Price increased 17.5% to $210,000
- Days on Market decreased 33.6% to 75
- Percent of Original List Price Received increased 2.5% to 97.5%
- Months Supply of Inventory decreased 27.1% to 3.5
Click here for the full Weekly Market Activity Report.From The Skinny.

Consumer confidence, prices, sales and percent of list price received at sale are all generally on the ups. This has been a nice place to be for real estate practitioners. In terms of expecting the unexpected trends, economists suggest tuning into indicators such as jobs, stocks and Federal Reserve policy decisions. The keen industry professional deserves the most up-to-date stats for daily decision making. Read on for this week’s deserved sneak peek.
In the Twin Cities region, for the week ending June 22:
- New Listings increased 28.9% to 1,797
- Pending Sales increased 14.1% to 1,214
- Inventory decreased 18.2% to 15,195
For the month of May:
- Median Sales Price increased 14.8% to $194,000
- Days on Market decreased 29.8% to 87
- Percent of Original List Price Received increased 2.5% to 97.0%
- Months Supply of Inventory decreased 30.6% to 3.4
Click here for the full Weekly Market Activity Report.From The Skinny.